
p-unit
Framework for unit tests and performance benchmarks

Discover. Evaluate. Test.
Open source metrics monitoring and time series database
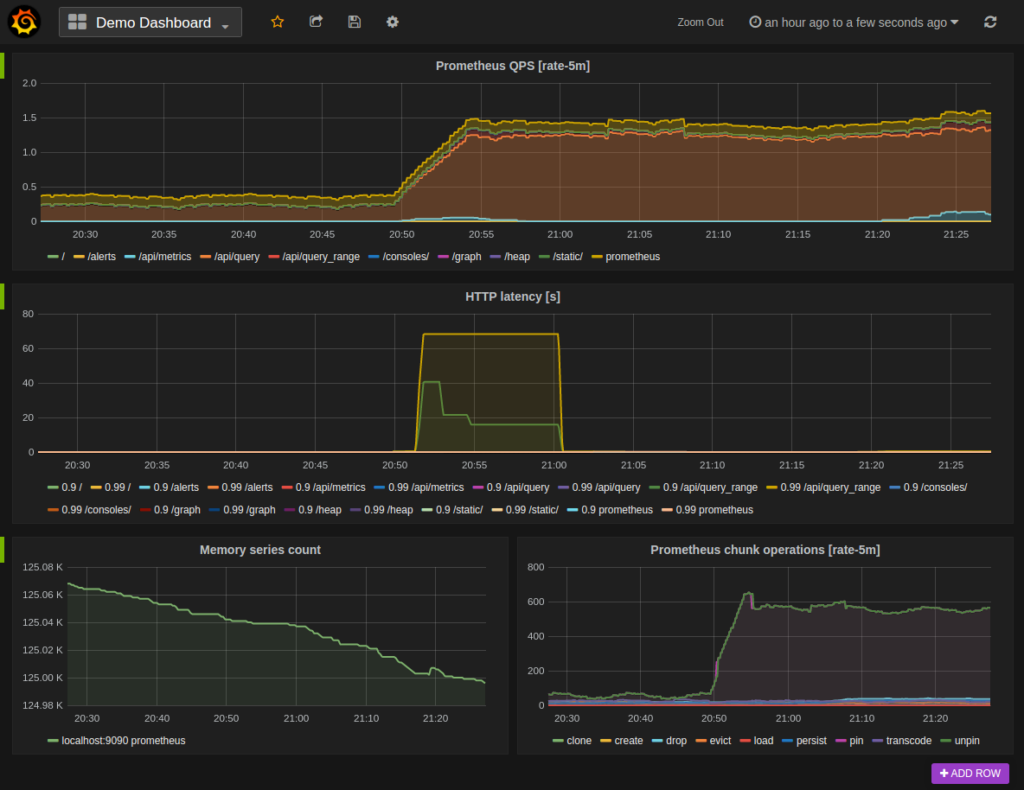
Prometheus is an open source monitoring system and time series database. It collects metrics from instrumented applications, systems and services by scraping HTTP endpoints, and stores them as time series identified by a metric name and key-value labels.
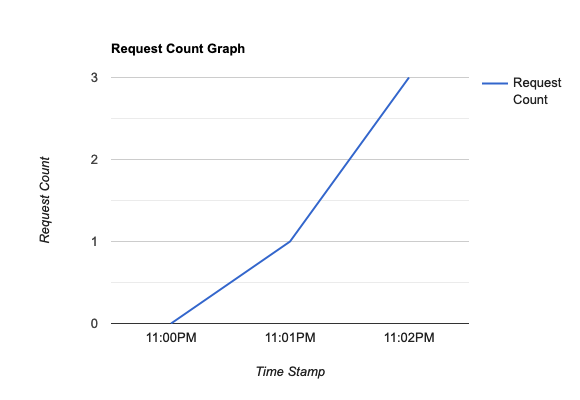
The PromQL query language selects, correlates and transforms the data for graphs, dashboards and alerts. Alerting rules are written in PromQL, and a separate Alertmanager component handles notifications. Many load testing tools, such as k6, Gatling or Locust, can export their results to Prometheus, so that test metrics and server metrics are analysed together, usually in Grafana.
Prometheus is a Cloud Native Computing Foundation project. It is free and open source under the Apache 2.0 licence and runs as a single server binary.
There are no reviews yet.
Framework for unit tests and performance benchmarks

API testing platform for functional, performance and virtualization testing
Load testing for websites, mobile and enterprise apps
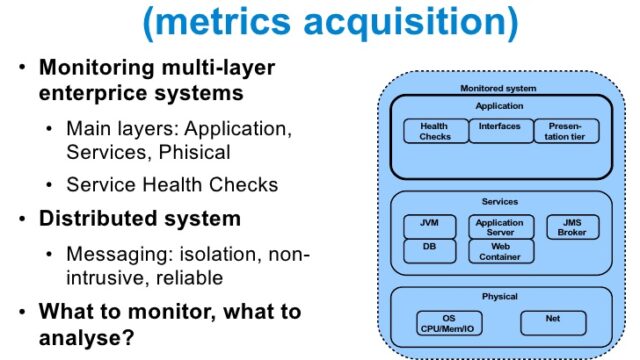
Open source runtime metrics collection and analysis system
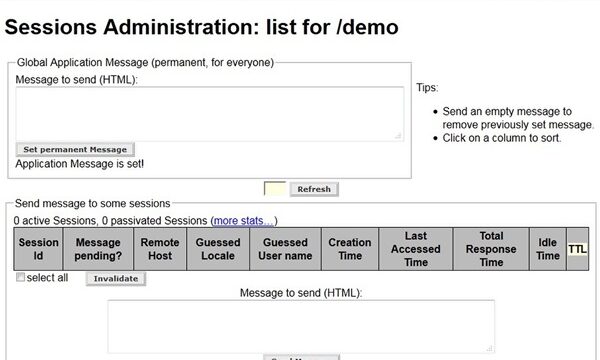
Monitoring and administration of Java EE HTTP sessions

HTTP benchmarking with multithreaded, event-driven load generation