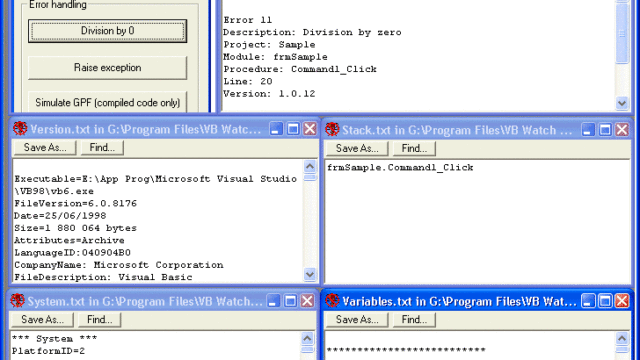
VB Watch
Profiler, error protector and debugger for VB6

Discover. Evaluate. Test.
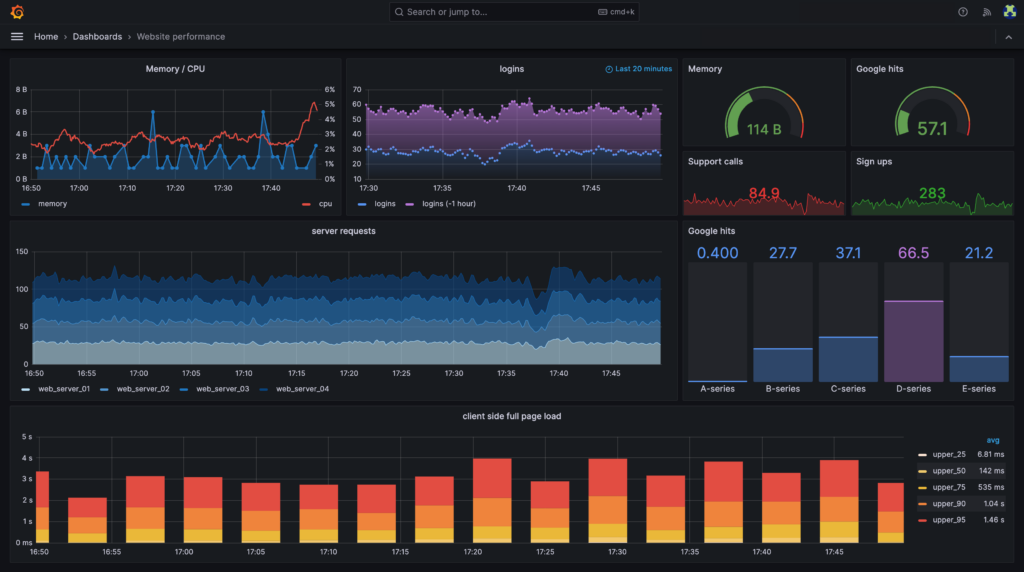
Open source dashboards for metrics, logs and traces
Grafana is an open source tool to query, visualise and alert on metrics, logs and traces. Through more than 150 data source plugins (Prometheus, InfluxDB, Graphite, Elasticsearch, SQL databases, cloud services and others), it combines data from several systems in a single dashboard.
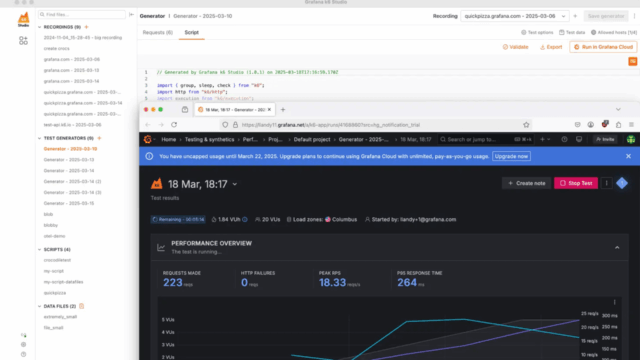
In performance testing, Grafana is commonly used to follow a load test in real time, displaying the metrics sent by the test tool next to server and application metrics. Tools such as k6, JMeter, Gatling and sitespeed.io provide ready-made Grafana dashboards. Dashboards and alerts can be managed as code and deployed from a pipeline.
Grafana is developed by Grafana Labs and is free and open source under the AGPL-3.0 licence. It is also available as a managed service in Grafana Cloud, which has a free tier, and as Grafana Enterprise.
There are no reviews yet.
Profiler, error protector and debugger for VB6
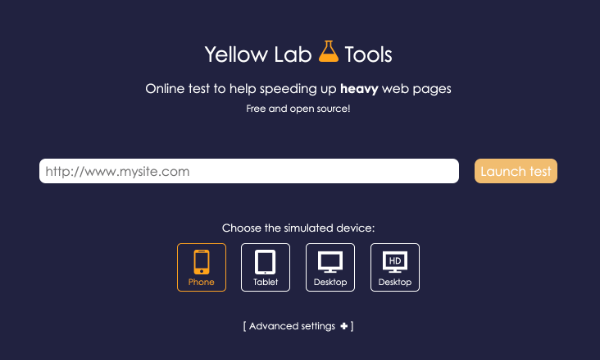
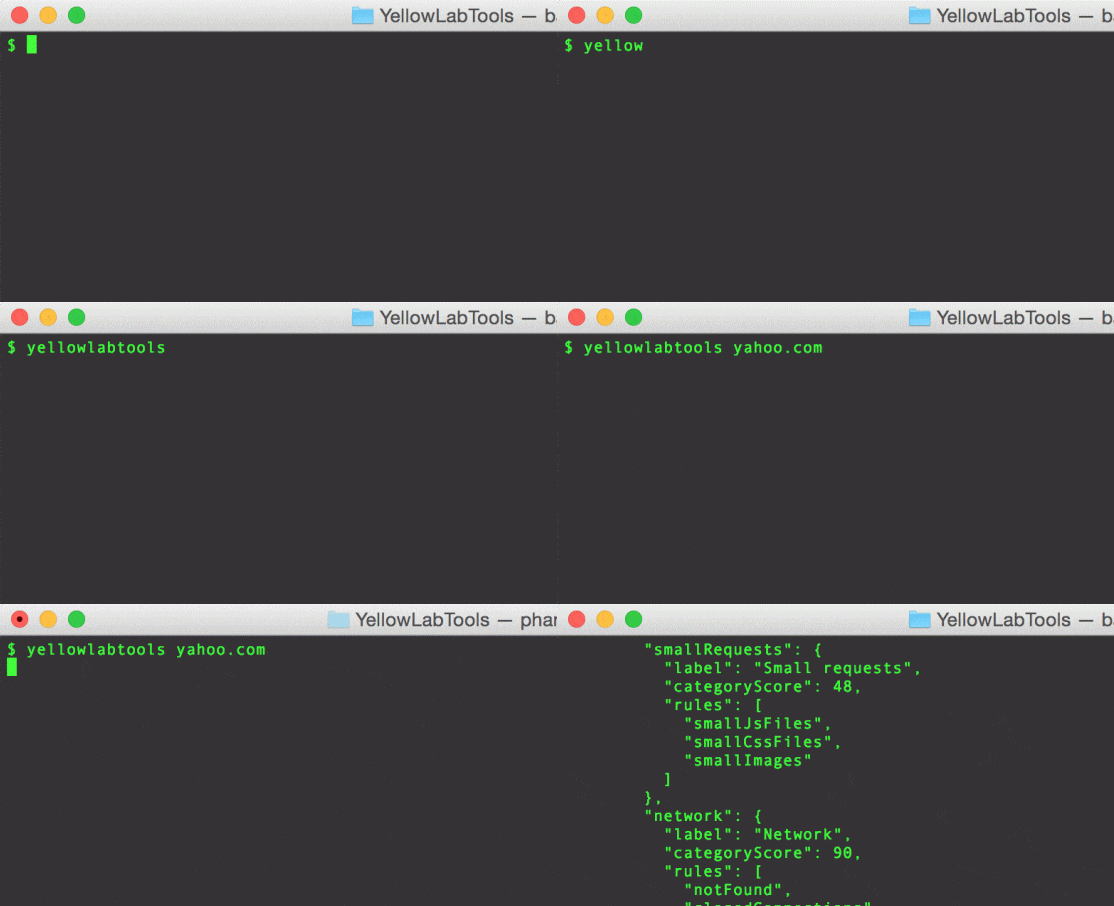
Front-end performance and code quality audit of web pages
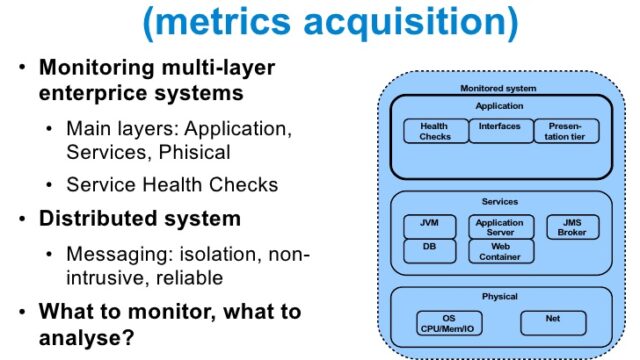
Open source runtime metrics collection and analysis system
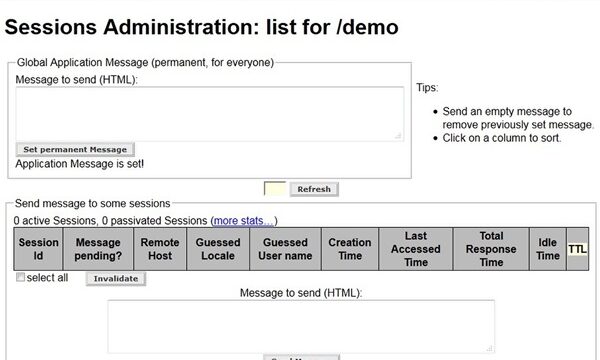
Monitoring and administration of Java EE HTTP sessions
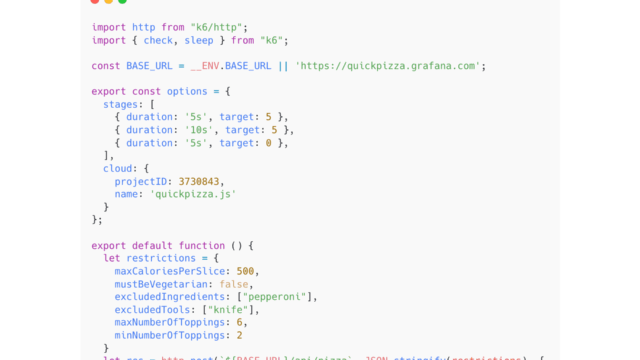
Open source k6 load testing tool and Grafana Cloud testing platform

HTTP load testing at a constant request rate